 ©Screenshot NOS
 The Royal Netherlands Meteorological Institute (KNMI) ascertained last week that the corona crisis had caused a significant decrease in air pollution in the Netherlands. Does that mean that industry and traffic are the leading causes of the carbon crisis, as farmers claim? No, the KNMI did not measure the farmers’ ammonia emissions.
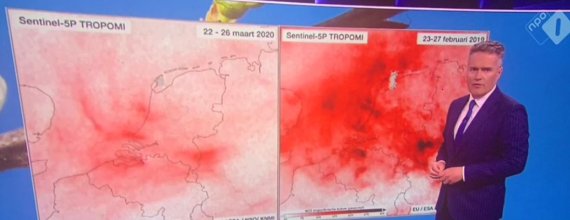
The NOS (Netherlands Broadcast Foundation) presented two images from the KNMI last week, showing the air pollution over the Netherlands as measured by the Europen Sentinel satellite. The images compared air pollution in February 2019 and 2020. Last year’s picture shows the Netherlands covered in red, indicating air pollution. In contrast, last February had just a few light pink spots over our country. According to the KNMI, air pollution has been reduced by 20 to 60 per cent as a result of the corona crisis measures.
Culprit
Farmer activists, among whom is former WUR president Aalt Dijkhuizen, seized the opportunity to create doubt as to the farmers’ contribution to the nitrogen crisis. How can the nitrogen deposits be 20 to 60 per cent lower when farmers continue to produce? ‘Is agriculture perhaps not the culprit?’ Dijkhuizen tweeted.
On the contrary, states nitrogen professor Wim de Vries of WUR. ‘The KNMI shows the emission levels of NOx: nitrogen pollution caused primarily by industry and traffic. The ammonia emission caused by farmers is not visible on the images.’
What sectors are responsible for lowering air pollution?
‘Especially foreign countries. Far less NOx reaches the Netherlands from Germany or Belgium. Also, the emissions caused by Dutch sectors that contribute to NOx emissions, such as road and air traffic, have decreased.’
Is the nitrogen contribution caused by road and air traffic higher than we assumed?
‘No, that is incorrect. Traffic in Germany and the Netherlands has decreased substantially. Given that these are the main sources of NOx, a reduction of 40 per cent (the average of 20 to 60 per cent), is quite possible. The upper limit of 60 per cent seems a bit excessive.’
Farmers have been actively fertilizing over the past weeks, so I smelled. Doesn’t this effect show?
‘The KNMI charts show NOx, not ammonia (NH3). Other Dutch scientists have also indicated that the KNMI images show nothing about the farmers’ emissions of nitrogen. See this fact check, for example.’