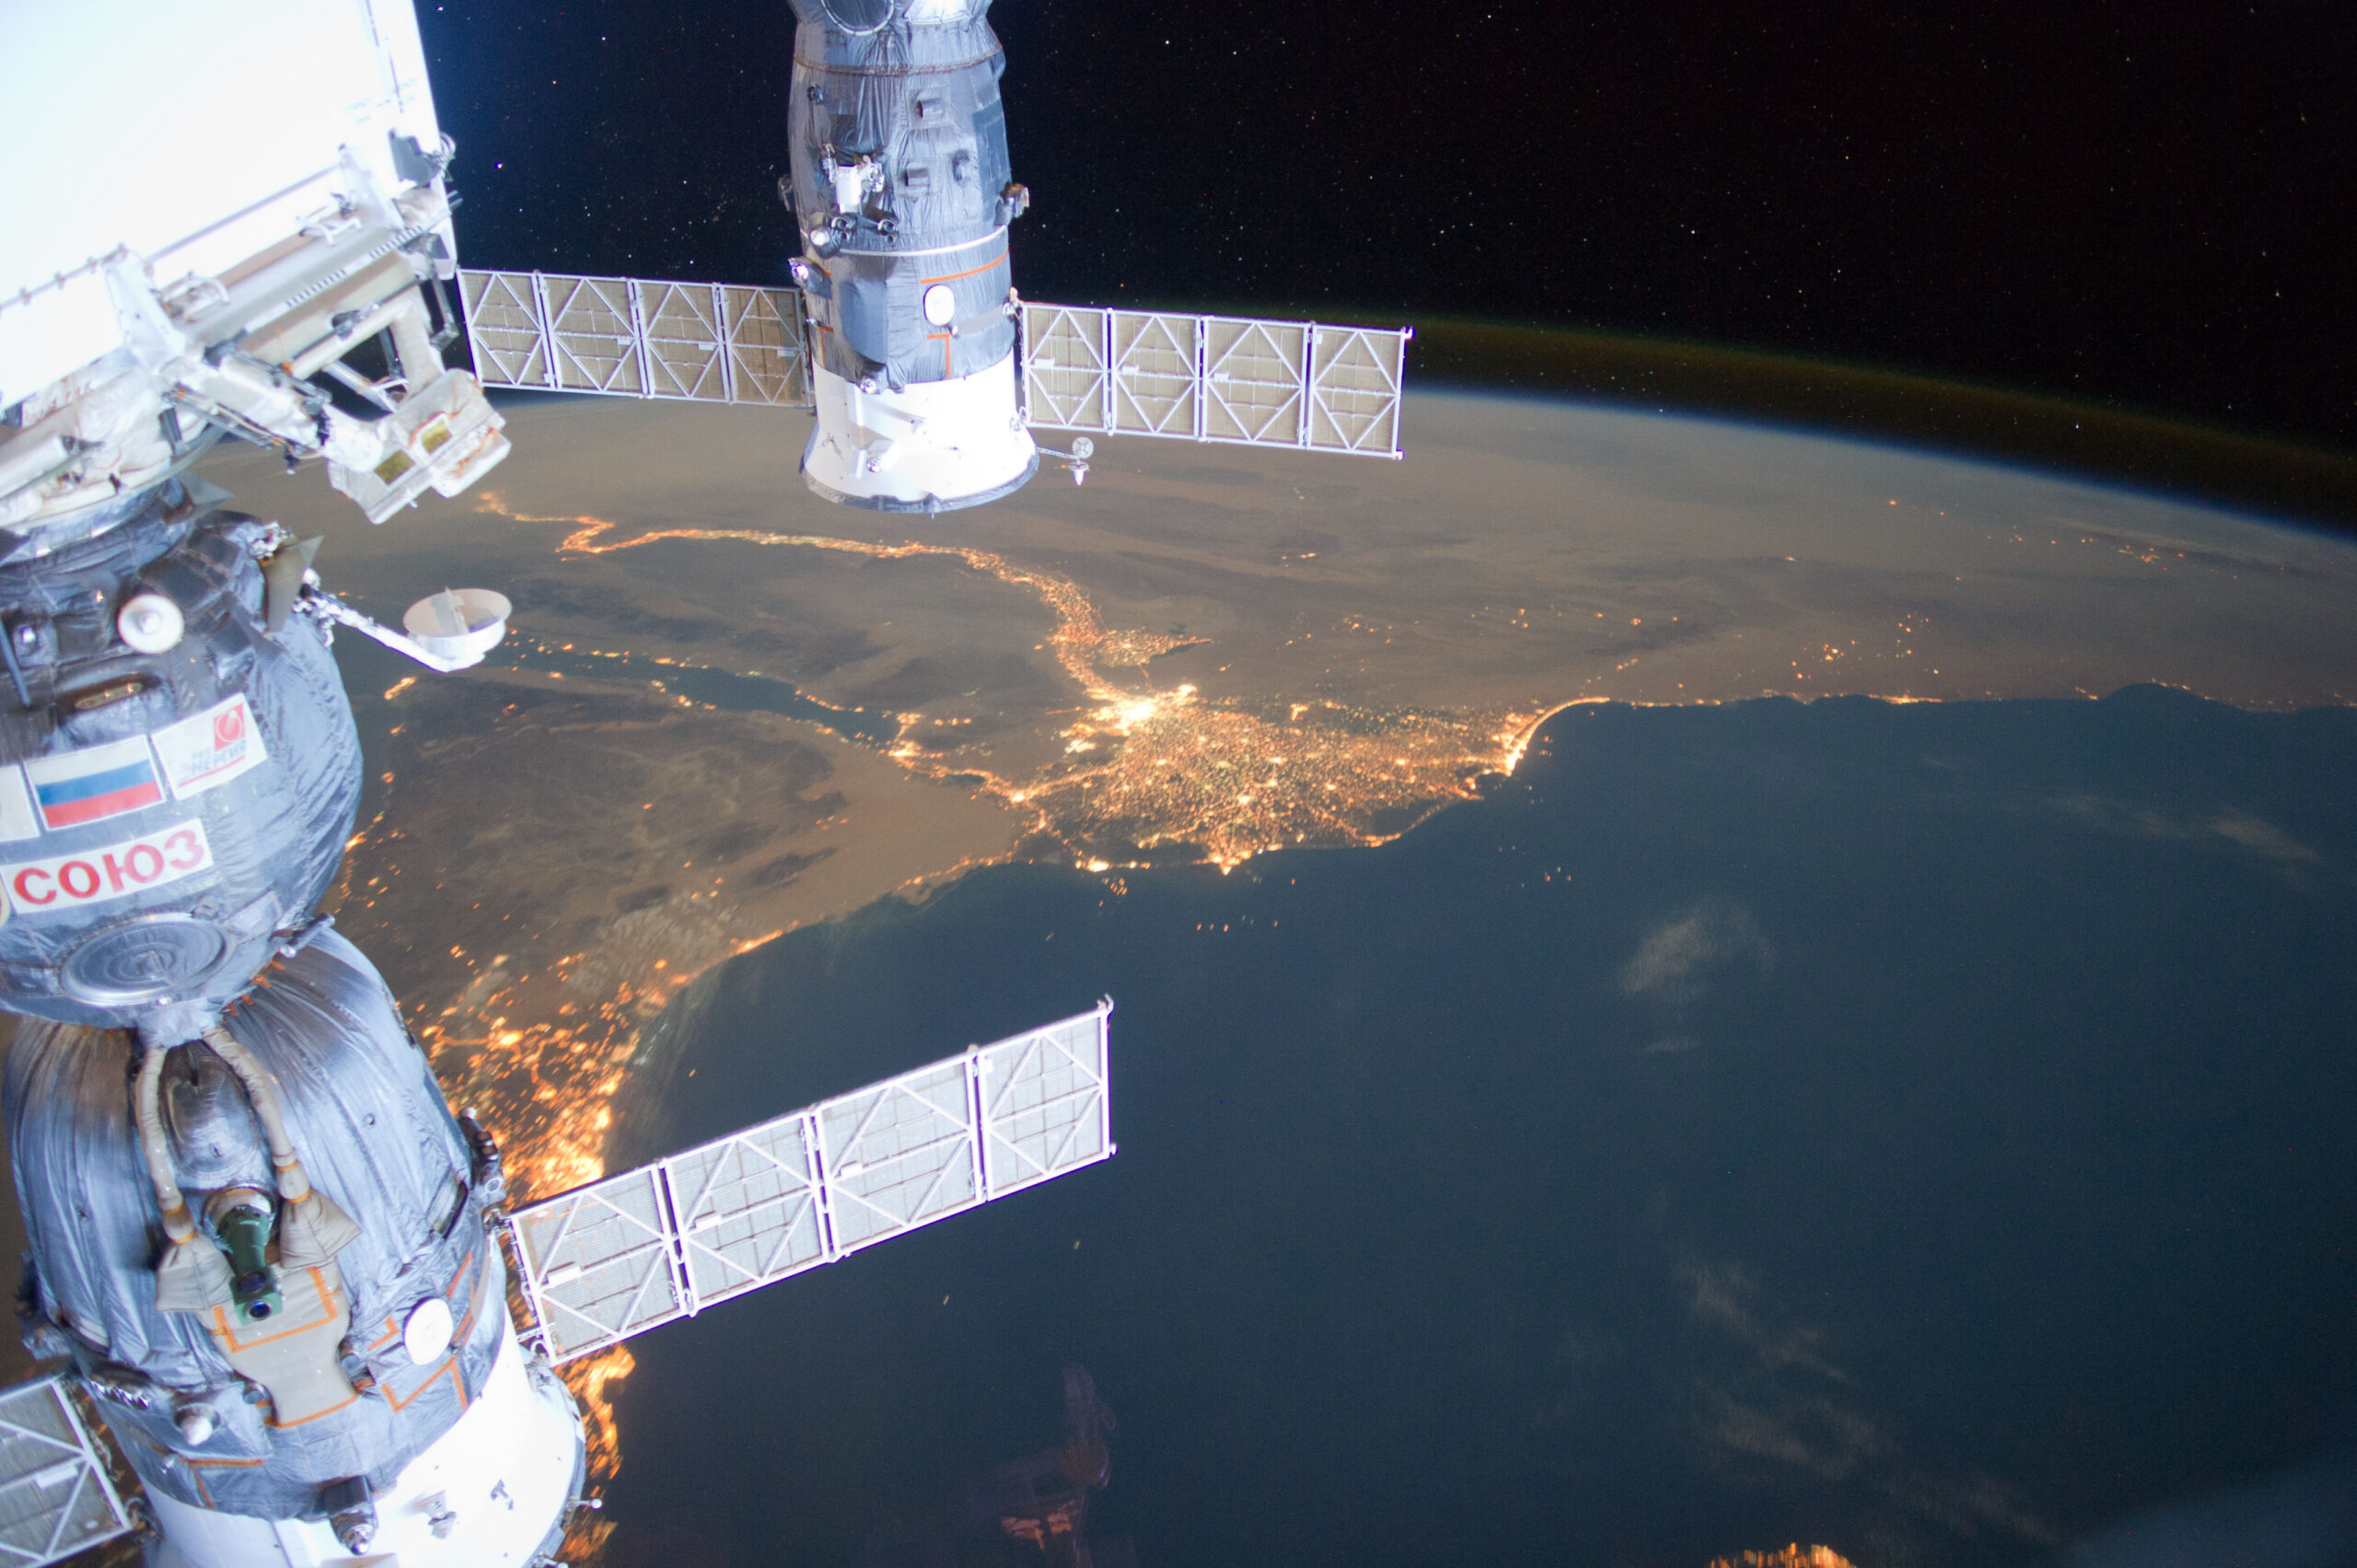
 Dutch ESA astronaut André Kuipers photographed night-time Egypt from his vantage point on the International Space Station. Photo European Space Agency/André Kuipers
 Seen from space, planet earth is rather well-lit. And that night-time light can be used as a surprisingly good indicator of the inequality in the world, discovered PhD student Usman Mirza.
The lighting in cities and towns produces pretty patterns in the dark. Seen from the air, night-time lighting illuminates the world map. Go one scale higher, and the picture from space is even more spectacular. The Pakistani PhD candidate M. Usman Mirza makes good use of our human ‘light footprint’ to map income inequality.
Driving forces
Mirza is an economist. And like many economists, the question that absorbs him is why some people are rich and others poor. What explains these differences? What driving forces lie behind inequality? Big questions, which have defeated many a researcher and thinker. Mirza is tackling them from an unusual angle for an economist: that of the Aquatic Ecology group led by Professor Marten Scheffer. This cries out for further explanation.
‘I was working as an environmental economist for a think tank in Pakistan,’ says Mirza, ‘when I saw a WUR advert for a PhD research project on resilience. The contact person was Professor Marten Scheffer. I responded that I was very interested in the subject, but that I was an economist. He said, that is just the job, because I can learn from you too.’ After thinking it over, Mirza decided to take on the challenge of being an economist among the ecologists. To balance things out, the environmental economist Andries Richter was appointed as one of his supervisors.
Gini index
Scheffer and his group are making a name for themselves with their research on the resilience of complex systems. Such systems are characterized by their ability to transition between two different stable states. An example would be a pond that is sometimes clear and sometimes murky. Mirza was interested in the resilience of poor people, through which rich people become poor and vice versa. ‘In the process I stumbled upon the topic of income distributions. That interested me even more: how incomes are distributed and how you can look at that from the complexity perspective.’
The standard way of measuring income inequality is the Gini index. This is a score between zero (everyone earns the same) and one (one party has everything, the other has nothing), which indicates the degree of inequality in an income distribution. In western countries where income data is plentiful, such calculations provide a realistic picture of the inequality. But in countries that are less well organized, the statistic is imprecise. In search of an alternative method of measuring inequality, Scheffer and Mirza came up with night-time light, inspired by a Nature paper on poverty in which Google street view images were used to map poverty in a neighbourhood. Mirza: ‘That set us thinking: could satellite images or data sources be a way of measuring inequality? And that’s how we ended up with night-time light as a possible indicator for income distribution.’
Light footprint
The light-based Gini index draws on two facts. Mirza: ‘First, rich people tend to live close to other rich people. And second: the rich have a greater light footprint, their activities use more light. This distinction between rich and poor applies in most countries. Rich people live in bigger houses in well-lit neighbourhoods. Poor people live in shanty neighbourhoods or even tented camps with less lighting. In general people’s light footprint increases with their incomes. That is not a one-to-one correspondence, but there is a definite correlation.’ The calculation is essentially quite simple. Mirza divided the amount of light on a square kilometre by the number of people living there, obtaining the amount of light per person. From the distribution of those values over a particular area, region or country, you get the light-based Gini index.
In general people’s light footprint increases with their incomes
Striking result
But it is not quite as straightforward as it sounds. ‘Remote sensing data are often messy and imprecise,’ says Mirza. ‘We exclude areas where nobody lives, such as industrial estates. And areas that are unlit, such as forests and deserts.’ But the result is striking. The light-based Gini score is pretty much in line with the incomes-based Gini score. ‘More work needs to be done on this, of course, but the method is promising and provides us with a reasonable estimate, which is a starting point for policymakers and further research.’
So it seems that nocturnal light is a good predictor of inequality, especially in places where the rich and the poor live in very separate areas. Mirza: ‘And that often happens in countries which are under-developed and for which little or no income data is available.’ The big advantage of the light-based Gini, according to Mirza, is that the figures can be compared across regions. ‘I make a standardized calculation using the same light data source for all regions. The income Gini is based on data provided by governments themselves, which vary in quality and method. That makes the figures less accurate and independent. The second big advantage is the spatial component, which you can relate to other environmental indicators such as land use or the availability of water.’
Complex dynamics
Mirza is convinced that there is no simple set of rules with which the dynamics of inequality can be described. ‘But this new approach of measuring inequality will provide researchers and policy makers with new insights into the complex dynamics of inequality.’

Global map of light based economic inequality.