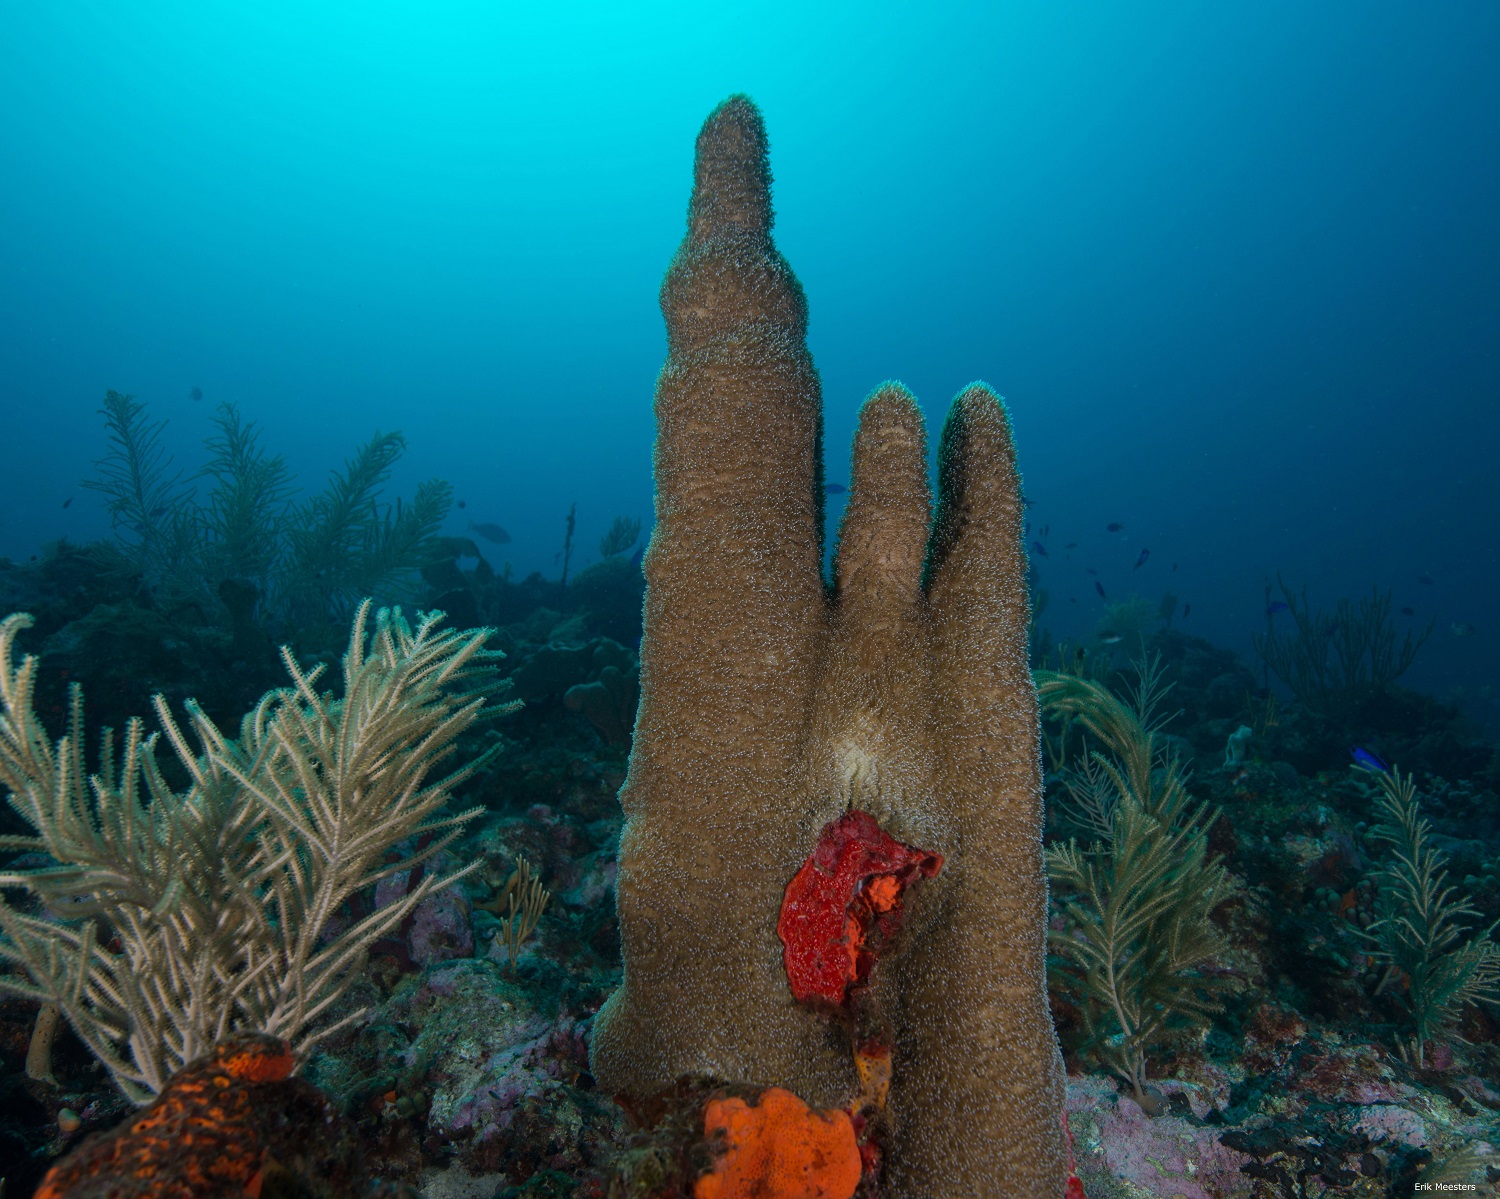
 Reef landscape at the Saba Bank.
 Nature conservationists know pretty much every square metre of national parks like the Hoge Veluwe. But that is not so easy for national parks at sea. Now marine researchers at WUR have managed to find a solution using artificial intelligence. The Saba Bank, one of the Netherlands’ largest national parks, now has its own map.
Of course there was already a geographical map. The Saba Bank is an underwater atoll located southwest of the Caribbean island of Saba. Most of the 60 by 40 kilometre bank lies 20 to 40 metres below the sea’s surface. But until now, there was no map showing precisely what kind of nature is found on the atoll. Now the gaps have been filled in by a team headed by marine tropical ecologist Erik Meesters.
Machine learning
Meesters and his colleagues trained the computer to classify existing photos from expeditions into ten different habitats. That information was linked to additional data on depth and location. The computer then made predictions of the habitat in places for which no photos were available but that did have the additional data. This is one of the first cases in which underwater nature has been mapped using machine learning.
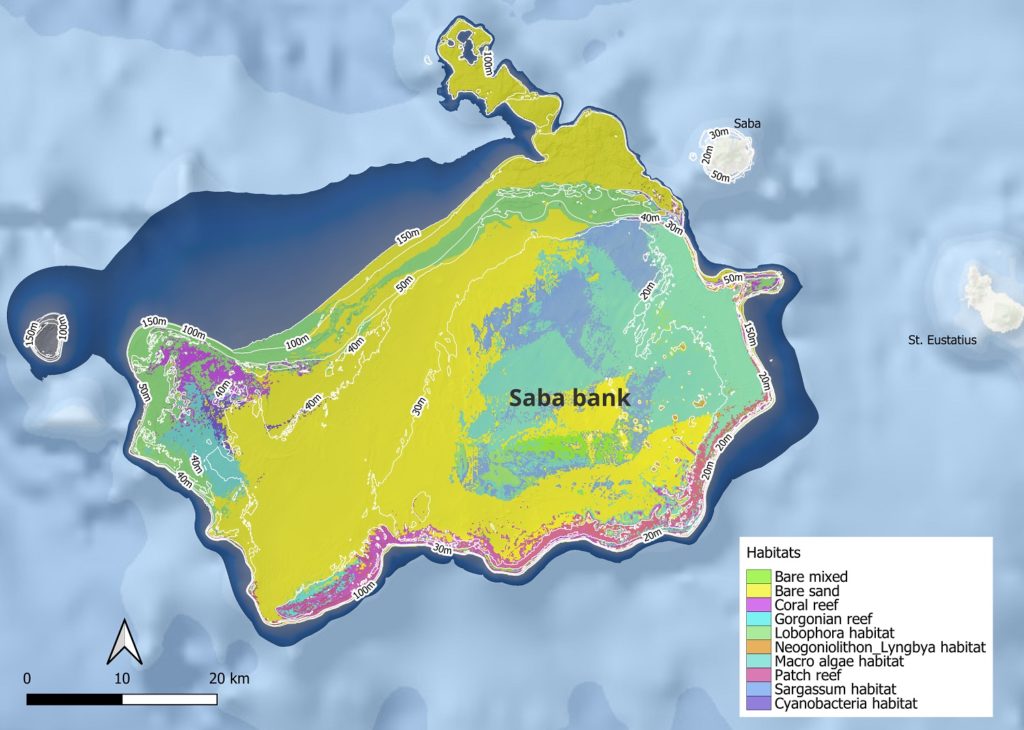
Around 2200 photos were used for the machine learning process. Which might seem like a lot, but it isn’t. Meesters: ‘The area covers 2500 square kilometres. So that is less than one photo per square kilometre. It means we have measurements for only a small part.’ Even so, the result is ‘pretty good’. The computer predicts the correct habitat in 70 per cent of cases, the researchers found by checking the prediction against photos of places that were not used in the learning process.
The computer predictions are mainly based on the depth, says Meesters. ‘The depth below the water’s surface is by far the most important factor. Depth determines the amount of light, the currents and the effect of the waves. Depth is a proxy, an indicator for the many different factors that shape the habitat. The distance from the edge of the Saba Bank is also important. The reef production is greatest on the edge, seen from the direction of the current.’
The map looks a bit like Australia. As you move towards the centre, it looks more and more like a sandy plain
Erik Meesters, marine tropical ecologist
That last point can be seen clearly in the resulting map. The southeast edge has the most life and all of the coral. Meesters: ‘The map looks a bit like Australia. As you move towards the centre, it looks more and more like a sandy plain. The waves cause the sand (which is essentially broken-down coral) to shift slowly towards the northwest. So you have more of a sand community there with starfish and shellfish.’
Understanding
The map is a snapshot. How fast everything changes depends on the kind of habitat, says Meesters. ‘Algae grow quite fast but coral much more slowly. So a coral reef is more stable than a field of algae. But coral can change rapidly too due to bleaching and disease. That is why it is so important to understand how the Saba Bank system works. That determines how the various habitats spread across the atoll. This map helps in that endeavour. We now know what is out there and we can start the process of getting a better understanding.’
There is room for improvement though in the accuracy of that information. Satellite images could be used, for example, to identify the presence of algae based on colours. Meesters: ‘It is not easy to get good satellite images. Conditions at sea have to be incredibly calm, with no clouds, or otherwise you don’t see anything. We have now found such images. We plan to add them to see whether that can improve the predictions.’