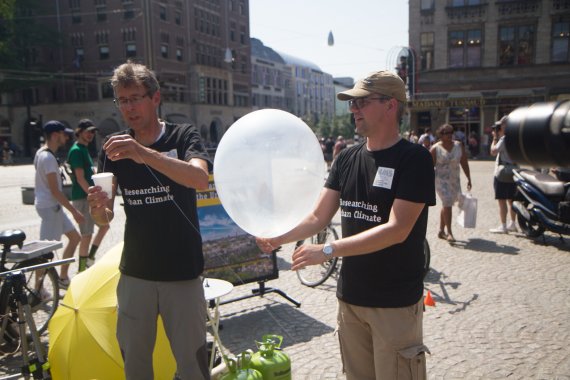
Researchers Bert Heusinkveld (left) and Gert-Jan Steeneveld (right). Photos © Tessa Louwerens
‘We are going to write Amsterdam history with these meteorological measurements’, says Gert-Jan Steeneveld, researcher at the Meteorology and Air Quality group. He is at Dam Square together with colleague Bert Heusinkveld and a team from AMS to release the weather balloons.
The city easily gets some eight degrees hotter.
Heat island
In the city, heat is retained by stones, roads and buildings, and the city itself also produces a lot of heat. ‘The impact of heat stress on residents is often underestimated’, Steeneveld says. ‘The city easily gets some eight degrees hotter.’ That is why he thinks it is important to map the weather profile of the city as accurately as possible. ‘That will allow us to make much more detailed models and predict the climate in an area where a hospital is located, for example, or in which many elderly people live, which in turn will allow for better response to those situations. Municipalities can also consider this when building new housing areas.’ The researchers want to measure to what extent the heat in the city differs measurably from the temperatures outside the city in order to find out how far this “urban heat island” extends.
Earlier today, we just missed rush hour at the Royal Palace of Amsterdam.
The cameras are running, and everyone is ready. And then… nothing. The helium tank appears to be empty. Fortunately, Steeneveld has another one in his hotel room. These things tend to happen when out in the field. The issue is quickly resolved, and the balloon takes off into the sky. According to Steeneveld, the wind is favourable right now. ‘Earlier today, we just missed rush hour at the Royal Palace of Amsterdam.’
Text continues below the photo.
City vs countryside
The balloon will rise to a height of around 2.5 kilometres. The plastic cup hanging beneath the balloon contains a radio sensor. It sends data about the temperature, humidity, wind speed and direction every few seconds. Simultaneously to the measurements above Amsterdam’s city centre, measurements are also taken just outside Amsterdam. This enables the researchers to find the crossover point: the altitude in the atmosphere at which the heat island effect is no longer noticeable and the temperature is the same as that above the countryside.
Power nap
The researchers have been working since Tuesday evening ten o’clock, launching a balloon every two hours. ‘This way, we get a complete overview of a full day and night cycle.’ However, this comes at the expense of their own rhythm. ‘We have a hotel room here, right next to Dam Square, so every now and then, we can take a power nap.’
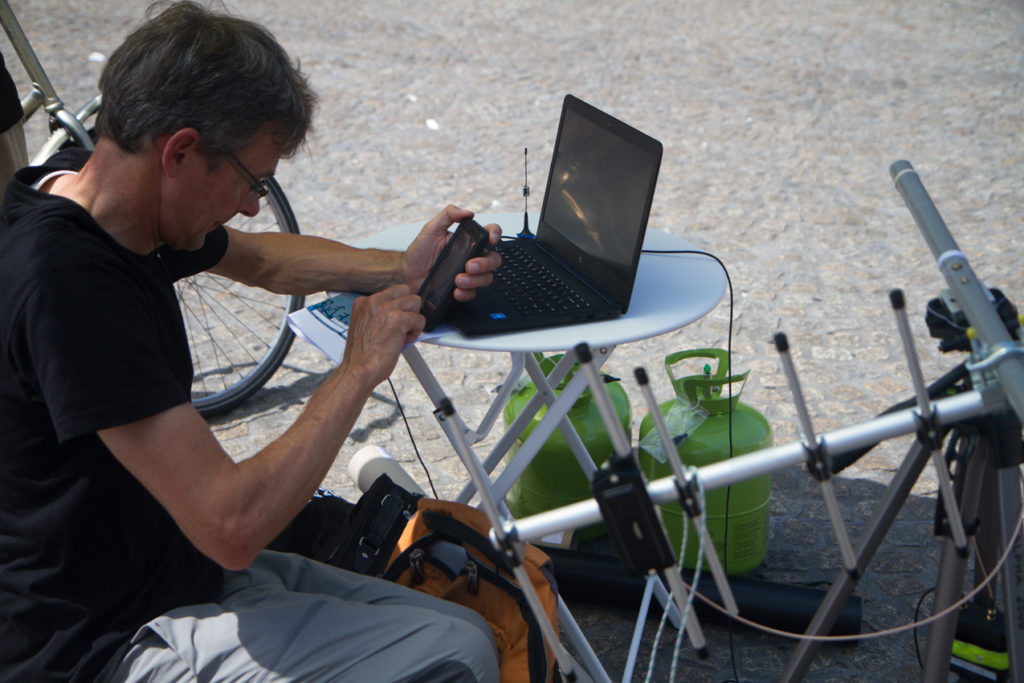
Heusinkveld is sitting ready at his laptop, which is placed on a table next to a large antenna. This antenna picks up the signals transmitted by the sensor from the balloon. Heusinkveld holds a parasol above the laptop. ‘It also suffers from heat stress. Generating all these graphs asks a lot of the processor.’ The first raw data already appears on the laptop.
Reward for missing sensor
Each balloon flies for about 40 minutes, after which an electrical pulse burns the string and the sensor falls to the ground. Thus far, to Steeneveld’s knowing, that went without problem, and no sensor has landed on anyone’s head. ‘They can also drop outside the city and are very small.’ Subsequently, the researchers can search for the sensors using GPS. ‘So far, we are missing only one. It might have landed somewhere in the Westelijk Havengebied, possibly in the water.’ The coordinates are on Twitter, and the person who returns it will receive a nice reward.
Climate freight tricycle
In addition to the measurements in the air, measurements are also made at ground level. This is done by students. Sophie van der Horst, master’s student Climate Studies at WUR is ready to go on the “climate freight tricycle”. It is fully climate friendly, with solar panels installed on its rack. The tricycle has all kinds of equipment that measure temperature, radiation, humidity wind speed and more. ‘We know that each of these factors has an impact on people’s heat balance’, Heusinkveld says. He explains the route of about eight kilometres. ‘That part of the Red Light district has some tight turns, so we’ll see if it works out.’ Sophie is confident. ‘Fortunately, that is towards the end of the route, so I will have a lot of time to practice.’
Sophie van der Horst, master’s student Climate Studies at WUR, is ready to go on the “climate freight tricycle”.
Combining data
In addition to all this data, the researchers also collect data on air pollution by measuring the troposphere, which is the lower layer of the atmosphere in which pollution effects are noticeable. Heusinkveld: ‘The troposphere is thicker on hot days and forms a kind of cover over the city. As a result, air pollution lingers in the city longer on summer days, and that has an impact on the health of the inhabitants.’
Furthermore, wind speeds are measured from the roof of the AMS Institute located on the Marineterrein Amsterdam. At high temperatures, wind and wind variations are important to ensure pleasant cooling, but also for a better and faster spread of air pollution. All this data is combined and is part of the joint research project Amsterdam Atmospheric Monitoring Supersite. This project monitors the horizontal weather profile of the city through 25 monitoring stations.