 Photo: WUR, Meteorology and Air Quality
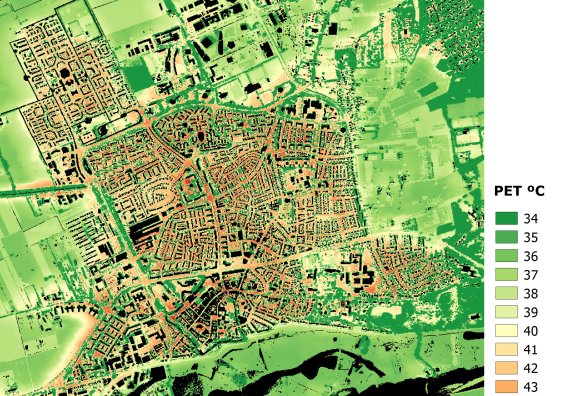
 The map shows how hot or cold it feels in various parts of Wageningen on a random hot day. The typical day chosen for the model is a July day in 2017 when temperatures rose to 35 degrees Celsius.
Heat stress test
Researchers Bert Heusinkveld, Gert-Jan Steeneveld and Sytse Koopmans are the men behind the heat map. The reason for the map is the requirement for local authorities to perform a heat stress test this year. The test should reveal where heat levels could become extreme and where the risks to public health and infrastructure are greatest. Heusinkveld: ‘We were asked to draw up a procedure for such heat maps as part of the major Spatial Adaptation plan.’
The apparent temperature measures how hot it feels.
Gert-Jan Steeneveld
Heat maps are not a new concept and there are already various commercial products on the market. ‘But they are based on satellite images of radiation intensity, for example, and are not very realistic,’ says Heusinkveld. The Wageningen scientists produced a map based on the apparent temperature. ‘This measures how hot it feels,’ explains Steeneveld, ‘because it takes account of factors such as the intensity of the solar radiation and wind speeds.’ Calculating the apparent temperature requires data on land use, buildings, trees, streets and water features in addition to meteorological data.

‘De gevoelstemperatuur houdt rekening met de beleving van de warmte’, legt Steeneveld uit, ‘doordat onder meer de intensiteit van de zonnestraling en de windsnelheid worden meegenomen.’ Om die gevoelstemperatuur in detail te kunnen berekenen, zijn naast meteorologische data een groot aantal geografische gegevens nodig over landgebruik, gebouwen, bomen, straten en waterpartijen.’ De weergegevens komen in dit geval van het eigen meetstation in het Binnenveld.
40 Degrees
The resulting urban map is hot stuff. The apparent temperature can rise above 40 degrees in many places, particularly in spots sheltered from the wind with a lot of direct sunlight. ‘Wind chill is a key factor in the apparent temperature,’ says Heusinkveld. ‘That’s one of the reasons why the campus is a cool place: it is open terrain.’
The Wageningen procedure for creating a heat map has now been designated the standard by the ministry of Infrastructure and Water Management, says Steeneveld.