Photo: Rianne Kluck
On Friday, 20 January a large group of students gathered after lunch on the lawn in front of the Orion building. On one side were the female students standing neatly in lines, with the ones at the front holding boards. On the other side of the path were all the men. A further investigation revealed that this was not a speed-dating event; rather it was part of the first-year genetics practical.
‘We are using this assignment to show students that some characteristics, in this case height, vary continuously so that you get a normal distribution with a bell-shaped graph,’ explains lecturer Sijmen Schoustra. To do this, the students were divided into rows depending on their height. Then photos were taken from above. This gave a kind of student bar chart. The textbook has an old photo from 1914 in which male students were also divided up in this way. ‘The NRC newspaper has a “Recreate the photo” section, which is what gave us the idea,’ says Schoustra.
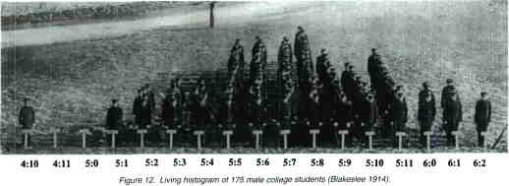
Male students of the Connecticut Agriculture College in 1914. Blakeslee et al.
The lecturer had photos taken of all the students together and of the women and men separately. It was the second time that he had used this method for the practical and it would certainly not be his last. ‘This brings the subject to life for the students.’ Statistics does not have to be heavy going.
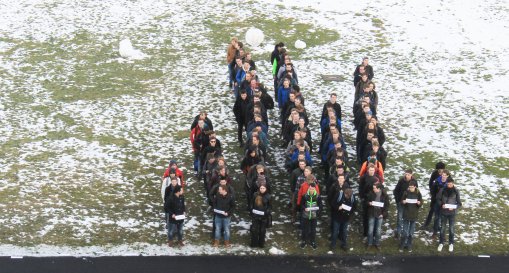
The group of male students taking part in a genetics practical form a bar chart based on their height on the lawn in front of Orion. Photo: Rianne Kluck